How much of the world’s energy is supplied by renewables?

Estimates of the contribution of renewable energy sources to the global energy mix vary significantly. This post documents and analyses these discrepancies.
A guest post by Roger Andrews, first published at Energy Matters.
BP and the International Energy Agency (IEA) measure the contribution of renewables to the global energy mix in terms of primary energy consumed while the World Bank estimates it in terms of final energy consumed. All three give different results, with BP estimating a total renewables contribution of 9.5% in 2015 compared to IEA’s 13.7% and the World Bank’s 18.1%. The BP/IEA differences become larger when contributions are segregated by source (BP estimates almost three times as much energy from hydro as IEA and IEA estimates four times as much energy from “other renewables” as BP). This post documents these discrepancies while making no attempt to say who is right and who is wrong – that would have to be the subject of another post. But it does raise the question of whether we really know how large a contribution renewables are making to the world’s energy mix.
The BP and IEA “primary energy” estimates
It’s important to establish exactly what primary energy is before proceeding. Fortunately there is general agreement on how to define it:
OECD: Primary energy consumption refers to the direct use at the source, or supply to users without transformation, of crude energy, that is, energy that has not been subjected to any conversion or transformation process.
United Nations: Primary energy should be used to designate energy from sources that involve only extraction or capture
Wikipedia: Primary energy is an energy form found in nature that has not been subjected to any human engineered conversion or transformation process. It is energy contained in raw fuels, and other forms of energy received as input to a system.
European Commission: Energy commodities are either extracted or captured directly from natural resources (and are termed primary) such as crude oil, hard coal, natural gas, or are produced from primary commodities. All energy commodities which are not primary but produced from primary commodities are termed secondary commodities. Secondary energy comes from the transformation of primary or secondary energy.
Global CCS Institute: A primary energy source is defined as one that is captured directly from natural resources. A secondary energy source is one obtained from a primary energy source through a transformation process, typically with the aim to make it suitable for a particular energy use.
According to my interpretation of these definitions energy counts as primary only if it hasn’t been run through a power plant, a refinery, a furnace or some other type of processing facility. We will continue on this basis.
First we will compare the BP and IEA primary energy estimates for 2015, the last year for which I have data for both. The BP data are from BP’s “primary energy consumption” table in the 2017 BP Statistical Review. The IEA data are calculated from the right-hand TPES (total primary energy supply) graphic in the IEA’s Key Energy Statistics 2017 report, which is reproduced below as Figure 1:
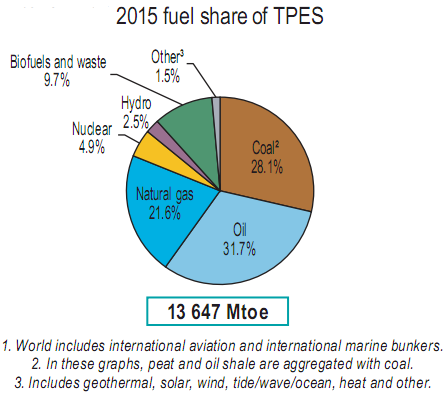
Figure 1: IEA’s pie chart showing percentages by fuel type in the
global total primary energy mix, 2015
Table 1 compares the BP and IEA total primary energy estimates by fuel type. The oil, gas and coal numbers match reasonably closely, as do the global totals:
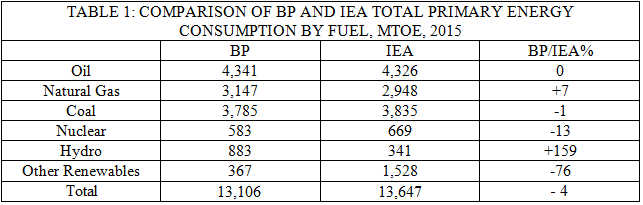
But the “Hydro” and “Other Renewables” values bear no resemblance to each other. What are the reasons for this?
First we will look at hydro. BP required 2.6 times as much primary energy as IEA to generate substantially the same amount of electricity (BP 3,903 TWh and IEA 3,978 TWh in 2015). This difference occurs because BP and IEA used different power plant heat conversion factors to estimate primary (input) energy, with BP assuming 38% for hydro and IEA 100%. (According to BP the 38% conversion factor applies only to thermal combustion plants, but its Mtoe and TWh values for hydro, wind, solar, biomass etc., which are tabulated separately, confirm that it used a 38% conversion factor for renewable plants as well. The 13% difference in nuclear primary energy is also largely explained by the use of different conversion factors, with BP assuming 38% and IEA 33%.)
IEA explains its choice of conversion factors in this article, but the graphic below provides a good potted summary:
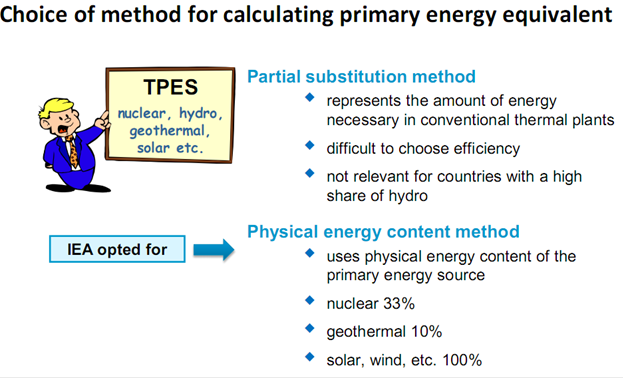
Figure 2: IEA’s choice of method for calculating primary energy equivalent
The Other Renewables” category listed in Table 1 is complicated by definitional differences, with BP reporting four categories (“wind”, “solar”, “biomass & other” and “biofuels”) and IEA only two (“biofuels & waste” and “other”, with “other” including solar, wind, geothermal, tidal etc. all lumped together). However, if we assume that IEA’s “other” category is effectively all wind and solar we can make the following approximate comparison:
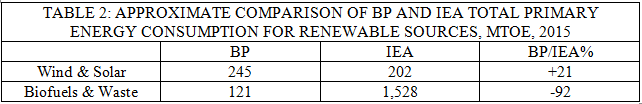
The difference in wind & solar is comparatively small, but IEA shows over ten times as much primary energy from “biofuels and waste” as BP does from its “biomass & other” category. The reason for this is that IEA includes a number of primary energy sources that BP does not. IEA defines the “biofuels and waste” category in some detail here, but basically it consists of biogas, biofuels and various industrial wastes (which, incidentally, do not strictly qualify as “primary energy”) plus wood etc. burned on cooking fires. IEA also admits that its estimates are not reliable:
Data under this heading are often based on small sample surveys or other incomplete information. Thus the data give only a broad impression of developments, and are not strictly comparable between countries. In some cases complete categories of vegetal fuel are omitted through lack of information.
So where do these conflicts between BP and IEA leave us? The three key questions are a) what fraction of the world’s primary energy is provided by renewables, b) how fast renewables are growing, and c) which renewable sources are contributing the most to growth. But when we plot the BP and IEA data over time we get different answers, as illustrated in Figure 3. IEA shows no significant change in the percentage of renewables (biomass, wind, solar etc. plus hydro) in the world’s energy mix since 1971, with the sum of both ranging from 12-14% over this period. BP shows the renewables contribution to the world’s primary energy mix growing from 5.5% in 1971 to 9.5% in 2015, largely because of modest growth in renewables since about 2000, as defined by the thin green wedge in the top right corner. (The BP data are from the 2017 Statistical Review and the IEA data are scaled off the “World TPES by fuel” chart in IEA’s Key Energy Statistics 2017 report linked to above. “Renewables” have been lumped together rather than segregated into categories because of the definitional uncertainties discussed earlier):
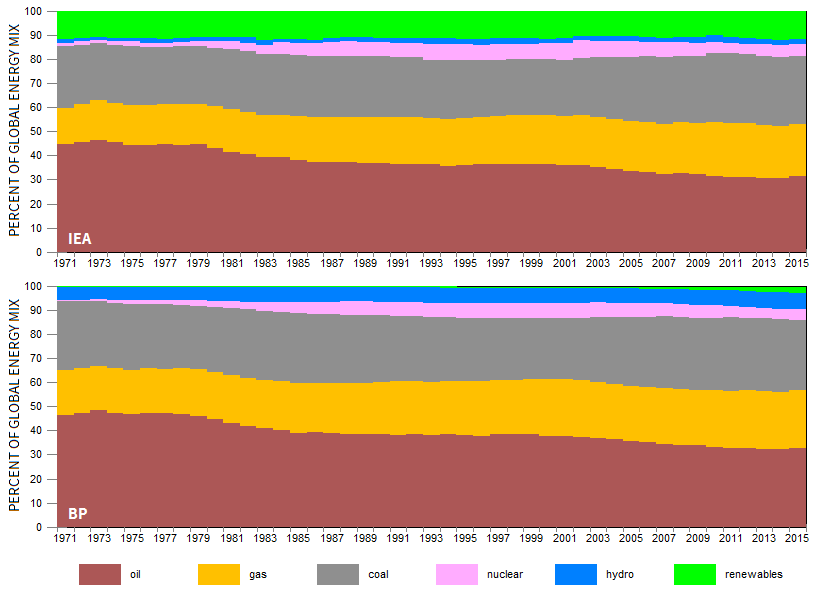
Figure 3: Percentage contribution to the global energy mix by fuel type since 1971,
BP and IEA estimates
The World Bank “total final energy” estimates
I have been unable to discover exactly how the World Bank defines total final energy, but in its lengthy Global Tracking Framework report it has this to say:
There are various definitional and methodological challenges in measuring and tracking the share of renewable energy in the global energy mix …. an important methodological choice is whether tracking should be undertaken at the primary level of the energy balance or on the basis of final energy. Power generation from fossil fuels leads to substantial energy losses in conversion, leading to a discrepancy between primary energy, or fuel input, and final energy, or useful energy output. Since renewable energy sources do not have fuel inputs, they are only reported in final energy terms; expressing them in primary terms would require the use of somewhat arbitrary conversion factors…..
A definition of final energy is nevertheless provided by Economia & Energia, according to which final energy “designates the energy as the consumer in the different sectors receives it, be it in the primary or secondary form” and “represents roughly the form in which energy is commercialized.” It comes accompanied by the following explanatory graphic (the European Union adopts a similar “gross final energy” approach but does not provide global generation mix estimates. For those interested in more details on the EU results Euan Mearns compared them with the BP estimates for Europe in his Renewable energy accounting methodologies post):
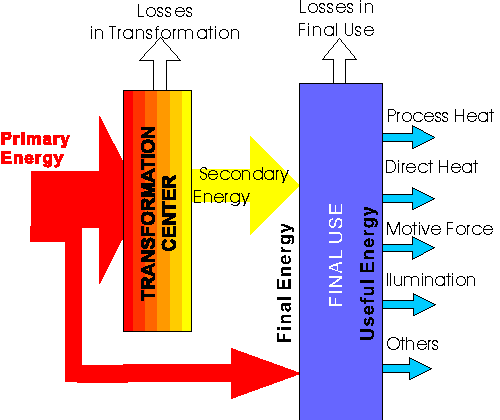
Figure 5: Graphical definition of “final energy” according to Economia & Energia
As far as I can tell final energy allows for losses during transformation from primary to secondary energy but does not include energy losses after “commercialization” (the internal combustion engine, for example, is only about 25% efficient), so it does not tell us how much energy we actually get to use.
Figure 4 compares the World Bank’s “final energy” percentage estimates of renewables in the global energy mix since 1990 against the BP and IEA “primary energy” estimates since 1971. They are significantly higher than either IEA’s or BP’s, although again they show only modest growth. (Note that the World bank does not segregate renewables by source, or at least not in this publication):
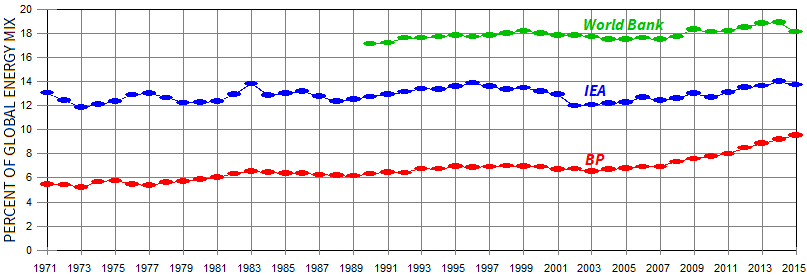
Figure 4: Total percentage of renewables in the global energy mix, BP, IEA and
World Bank. Note that various UN agencies and also the IEA participated in the
World Bank study.
So to answer the question posed in the title – how much of the world’s energy was supplied by renewables in 2015? Was it BP’s 9.5%, IEA’s 13.7%, the World Bank’s 18.1% or none of the above? I’ll leave that question hanging.
About the author:
Roger Andrews is a retired mining geologist and geophysicist. Born in the UK, he spent most of his professional career in Australia and the USA. He is now retired but continues to write informed, incisive and popular energy analyses for the Energy Matters blog.
Disclaimer:
The views and opinions expressed in this article are the author’s own.

The partial substitution method of BP may be considered as irrelevant for hydro (which is a “cold” source of electricity), the physical energy content method (adopted by the IEA and Eurostats) is not less biased as it favors by a factor of 3 nuclear power compared to hydro, even in cases it generates the same amount of electricity! But giving a ratio of 3 to nuclear power simply because it is a “very hot” source, which is an internal “affair” of the system that has nothing to do with the primary energy source calculation, is not less irrelevant than applying a 2.6 ratio to hydro with BP’s method. All energy conversion methods are inherently subjective. It just depends which energy source one wants to give an advantage to. See this paper with the example of Sweden generating an equal share of nuclear and hydro: https://doi.org/10.1016/j.energy.2011.08.038
If one wants to compare the contribution of renewables that generates electricity, then let’s stick with a comparison based on the electricity mix (energy carriers), not on primary energy source which only are virtual numbers!
François Diaz-Maurin
http://www.fdiazmaurin.eu/
LikeLike