The boom of renewable energy jobs: boon or bane?

The rapid growth of renewable energy technologies is creating lots of jobs. But should we really rejoice?
François-Xavier Chevallerau | March 20, 2017
Renewable energy is on a roll worldwide and making up a growing share of new power capacity installed in many countries. New solar photovoltaic (PV) capacity installed in 2016 reached more than 76 gigawatts worldwide, an increase of some 50% on the 50GW installed the year before. Globally there is now 305GW of solar power capacity, up from around 50GW in 2010 and virtually nothing at the turn of the millennium. Wind power is also growing fast. Close to 55GW of new wind power capacity was installed worldwide last year, the industry’s second best year in terms of new installations worldwide after the record growth posted in 2015. The global total capacity installed now stands at more than 487GW, nearly half of which — 241GW — has been added in the past five years.
The impressive growth of wind and solar power over the last few years has, of course, been largely subsidy-driven. It has however brought with it falling costs and increased efficiency that are making renewables increasingly competitive in many places, fuelling hopes that their growth could become self-sustained in the not-too-distant future.
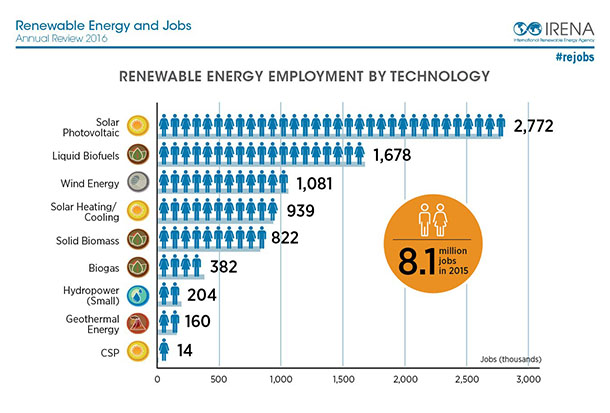
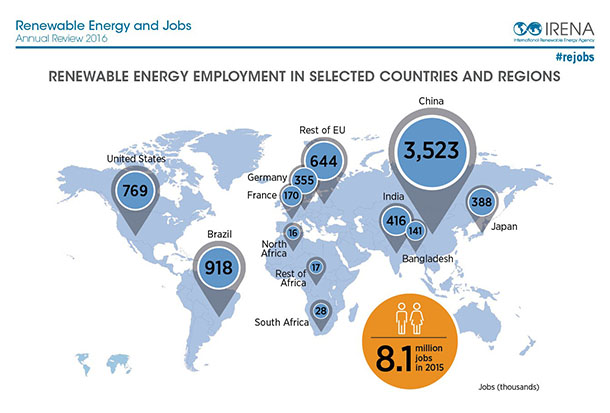
What the growth of renewables is also bringing with it is an impressive number of new jobs. According to the International Renewable Energy Agency (IRENA), an intergovernmental organization that promotes the adoption and sustainable use of renewable energy, 8.1 million people were employed in renewable energy around the world in 2015 (excluding large hydropower), a 5% increase from the number reported the previous year. The solar PV sector is by far the largest renewable energy employer worldwide with 2.8 million jobs (up 11% from 2.5 in 2015) in manufacturing, installation and operations & maintenance. Liquid biofuels is the second largest global employer with 1.7 million jobs, followed by wind power, which grew 5% to reach 1.1 million global jobs.
The rapid growth of renewable energy jobs is in stark contrast with depressed labour markets in the broader energy sector. In the United States for example, renewable energy jobs increased 6% in 2015 while employment in oil and gas decreased 18%. As a result, renewables now account for more jobs than the fossil fuel industries in many countries. In China, renewable energy employed 3.5 million people in 2015 according to IRENA figures, while oil and gas employed just 2.6 million. In the U.S., 377,280 people were employed in solar and wind electric generation in 2015, according to a recent report by the United States Department of Energy, while 171,878 ‘only’ had jobs related to electrical generation in the coal, gas and oil industries. Solar employment, which includes both photovoltaic electricity and concentrated solar steam generators, accounts for 43% of the U.S. electric power generation workforce – the largest share of workers in that market – vs. 22% for fossil fuel generation employment.
The growth of renewable energy jobs is expected to remain strong in the coming years. According to IRENA, more than 24 million jobs could be created worldwide by doubling the share of renewable energy in the global energy mix by 2030 – which it says should be ‘enough to meet global climate and development targets’. This growth is thus seen by many as a sign that the ongoing global energy transition is working and is accelerating. The ‘monumental job growth’ of clean energy is widely celebrated in the press, and renewables are increasingly touted as the economy’s new ‘job engine’, capable of rejuvenating the economy while saving the climate.
In fact, what’s not to like about the development of energy technologies that reduce carbon emissions while creating a lot of new jobs? People love new jobs, and so do governments, especially when these jobs cannot be easily offshored or automated, and when they bring in much needed new tax receipts and social contributions.
Exercising ‘healthy skepticism’
As in many other domains, though, a certain degree of ‘healthy skepticism’ should probably be exercised, for several reasons.
First, the growth of renewable energy jobs occurring in many countries mostly concerns installation and operations & maintenance jobs, while manufacturing jobs – and the higher value-added that goes with them – tend to mostly concentrate in one location, i.e. China. Fuelled by government handouts and low-cost loans, the Chinese solar industry dramatically expanded production of solar cells/modules and solar panels over the last decade, which largely explains the spectacular drop of solar prices. Thanks to this heavy government support, China has become by far the dominant force globally in the manufacturing of both solar cells and solar panels. A similar phenomenon is now at play in the wind sector, with Chinese manufacturers increasingly dominating the global market for wind turbines. As a result, a staggering 43% of the 8.1 million renewable energy jobs accounted for worldwide by IRENA for the year 2015 were located in China. Given the competitive advantage already acquired by its producers, China would likely remain the main beneficiary of a long-term boom in renewable energy employment figures.
Second, the growth of renewable energy jobs remains largely driven by what IRENA calls ‘enabling policy frameworks’, i.e. government interventions, in the form of regulations, incentives, and subsidies aimed at supporting the deployment of renewables – meaning that the benefits of job growth in renewables often come with a hefty monetary cost to government finances. Where and when incentives and subsidies are reduced or withdrawn due to budget constraints or choices, the growth of renewable energy jobs tends to stall or to reverse. Employment in solar PV, for example, decreased in the European Union (EU) in 2015 as a number of support schemes were winded down and the market for photovoltaic energy flattened. Even more spectacularly, employment in the Australian renewable energy sector collapsed by one third since government support was reduced by the Liberal–National Coalition that took power in 2013. Annual full time equivalent employment in renewable energy activities in Australia was estimated to be 11,150 in 2015-16, down 16% from 13,300 in 2014-15 and down from a peak of 19,220 in 2011-12, according to the Australian Bureau of Statistics (ABS). This is despite Australia having one of the most favorable environments for renewables – it receives more solar radiation per square foot than anywhere on the planet – and being one of the countries considered most at risk from climate change. In the U.S., the new administration seems to be intent on gutting or even eliminating federal government support to renewable energy research and deployment, which could potentially slow down or even reverse the growth of renewable energy jobs.
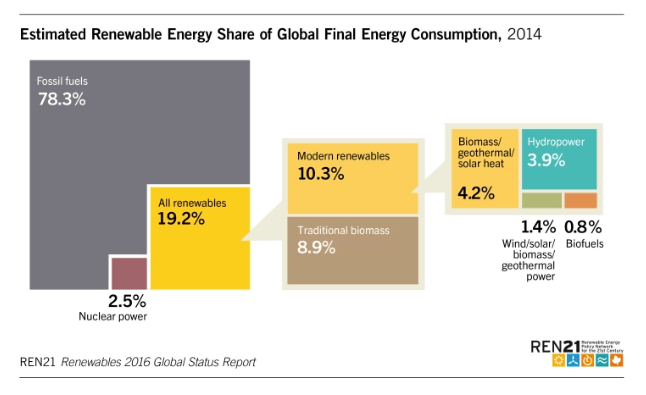
Third, and most importantly, even if solar and wind energy are very good at creating lots of jobs, their performance in terms of supplying energy to society – which is supposedly the primary purpose of any energy resource – remains far from being as spectacular. According to the Renewables 2016 Global Status Report published by REN21, a ‘global renewable energy policy multi-stakeholder network that connects a wide range of key actors’, wind and solar generated just 4.9% of global electricity production in 2015 (3.7% for wind and 1.2% for solar PV). Their share of global final energy consumption is even lower, at 1.4% for wind and solar plus biomass/geothermal power in 2014.

In other words, wind and solar so far provide human societies with proportionately far more jobs than energy or electricity – which means that the “energy productivity” of workers in the solar and wind industry remains far lower than that of workers in the fossil fuels industry. In the U.S., for instance, the 377,280 wind and solar generation workers produced 5.3% of the 4 trillion kilowatt-hours of electricity generated in the country in 2015 (utility-scale facilities only), while the 171,878 people working in electrical generation in the coal, gas and oil industries contributed 67%, meaning that each job in the fossil fuels generation sector was over 27 times more “energy productive” than a job in the wind and solar generation sector. This might be a rough estimate based on inadequate boundaries, but it still gives an idea of the energy productivity gap that separates renewables from fossil fuels.
One could argue that this gap appears wider than it really is because a lot of renewable energy jobs have to be created upfront to support new capacity installations, while much of the actual renewable energy generation is expected to ramp up over a longer term. Once a certain deployment scale is reached, it is hoped, operations will be streamlined and renewable jobs will become more productive. Similar upfront job-intensive investments probably had to be made during the early stages of previous energy transitions, when coal and then petroleum became the world’s dominant energy sources in the 19th century and 20th century respectively.
A major difference, though, is that previous energy transitions were always driven by the capacity of the new energy resources to provide society, in a relatively short period of time, with more, better quality and cheaper energy. Fossil fuels, and most particularly petroleum, became the master energy sources of the modern world because they were quickly shown to be far more powerful, economic, convenient and versatile sources of energy than the sources they replaced. Most importantly, fossil fuels came to dominate the world’s energy supply because they provided higher quality forms of energy inputs in terms of their ability to power useful or productive work, and because they delivered far more energy than what their production required – meaning that they made vast quantities of ‘net energy’ available to do other things than procuring, processing and distributing energy.
The expected transition to solar and wind, on the other hand, is the first energy transition in human history that is not driven by the intrinsic capability of those energy sources to provide more, better and cheaper energy – or more precisely ‘net energy’ – to society, in a relatively short lapse of time. Many of course argue that this is only a transitory situation, and that technological progress will soon make solar panels and wind turbines far more efficient and capable of delivering abundant and dirt cheap energy. However, it would actually take giant technological leaps forward for wind and solar to become more powerful, economic, convenient and versatile sources of energy than fossil fuels, capable of delivering energy on the scale needed to replace them. It would require massive new investments upstream in advanced materials as well as downstream in ‘smart’ and flexible grids to raise the current ‘ceiling’ for the use of renewables, with no guarantee of success. These investments, provided they could be funded and would not run into resource constraints, would probably take a very long time to pay off.
Energy as a cost center
Overall, the excitement about renewable energy’s job creation potential is understandable, but the current boom in renewable energy jobs should probably not be viewed as a sign that the transition to clean energy is now running full speed, or that clean energy has become a new miraculous job creation machine. Doing so would be misunderstanding the role of energy in society and the economy.
Energy is the fundamental input that is needed for all human activities, without exception: capital and labor are functionally inert without energy input, and it is only through the use of energy that they can be combined to produce and distribute goods and services. However, energy contributes to value creation in an indirect manner, depending on the ways in which and the ends to which it is used. To borrow from business management jargon, for human societies energy supply is a ‘cost center’ rather than a ‘profit center’, i.e. it is a sector or domain that does not directly add to profit (that is, to wealth creation or economic growth) but is nevertheless essential to the organization’s ability to operate effectively and profitably.
If they are intent on achieving value creation and economic growth, societies need, just like corporations, to continuously contain or reduce the cost of their cost centers and to make them more efficient. In the case of society’s energy cost center, this means reducing the cost of the energy supply and making it more productive, in energy terms. In other words, the energy cost center shall aim to supply ever more energy to society, while using ever less resources, including human resources. Only then can the energy supply cost center provide a positive long-term contribution to economic growth. So far, and for the foreseeable future, the boom in renewable energy jobs is achieving precisely the opposite. It increases the operational costs of our energy cost center, while making a very small contribution to increasing its output. As such, and should it continue, it might act as a drag on economic growth over the long term, even if it seems to provide a positive contribution to GDP in the short term.
Civil society and policy makers should therefore keep in mind that our energy cost center can either contribute to foster long-term economic growth or that it can add a lot of new jobs, but that it probably cannot do both. This doesn’t necessarily mean that the current push for renewable energies should be slowed down or reversed, as there are other reasons that underpin the choice to move towards renewable energy. But it should certainly help us fully understand what is in fact happening when we see headlines proclaiming, for example, that the solar and wind industries are now creating jobs at a rate 12 times faster than that of the rest of the U.S. economy.

I see three major flaws in this argument. First of all, it speaks of how renewables are subsidy-driven without acknowledging that fossil fuels get enormous subsidies and nuclear power even bigger ones. Let’s see a comparison between the subsidies given to the different sectors–even if we leave “externalities” out of it–before saying that the subsidies renewables get makes their growth illusory. Second, we see that renewables employ many more workers per MWh than fossil fuels; you can say they are therefore good job sources or you could look at it like an economist and say they are “less energy productive” jobs. Finally, you point to the much greater energy density of fossil fuels and suggest that renewables are therefore in comparison impractical. But this ignores the reality that fossil fuels must be endlessly trucked or piped to those plants, while the sunshine or wind will come in for free as long as their plants are operational; and they have had a very high density, being the fruit of millions of years of distilling by natural means, but the best and most energy-dense and most economically recoverable fossil fuels have already been burned. What’s left is increasingly lower quality, more expensive and often dangerous to acquire. This situation will only intensify as the progressively lower hanging “fruit” is used up.
LikeLike
Good points, Mary; complete lack of economic understanding in the ‘boon or bane’ piece. It should be obvious that the main cost of RE is upfront investment, followed by low maintenance and the savings from less fossil fuel. It’s elementary macroeconomics that large scale job creation in economies with 10 -20% underemployment as in the OECD has a major multiplier effect, raising incomes and growth. Renewables have another huge benefit not mentioned, reducing health costs of local pollution, estimated as 3% of global GDP by the IMF, probably much more, e.g.15% in China, and the objective of averting climate change is also neglected, though of course this will need much greater investment. Necessary ‘green fiscal policy’ could achieve near full employment and sustainable growth which is otherwise impossible. Such abysmally muddled pieces only provide (non-fossil) fuel for the fossil lobby which now drives the US (and Russia, totally dependent on fossil exports!)
Felix
LikeLike
All states have the same 15 solar federal level financial incentive programs that homes or businesses can apply for. One of them is a generous 30% federal solar investment tax credit. But states with just federal incentives produce the least solar power.
Many states offer solar financial incentives at the state, city, county, or utility level. California has by far the most – 49 of them (see http://www.dsireusa.org/ for subsidies in every state). This is a big reason California produces 60% of all U.S. solar power, followed by Arizona 14%, Nevada 7%, North Carolina 5.5%, New Jersey and New Mexico 2.5%, Massachusetts 1.8%, and Texas 1.6%. These 8 states provide 94% of all solar power and have some of the highest state incentives as well, especially in states further north where solar is less profitable.
State level financial incentives consist of rebates, corporate depreciation, tax credits, and tax exemptions, feed-in tariffs, grants, green building incentives, loans, net metering, PACE financing, personal tax credits and exemptions, and more. City level subsidies can be substantial. San Francisco has incentives of up to $10,500.
When there is another financial crash, it is highly unlikely that these subsidies will be maintained.
In the 11 states with the most potential solar power (21 to 35 degrees latitude), Georgia, Louisiana, Mississippi, Alabama, South Carolina, and Arkansas, produce only half a percent of U.S. solar power. These states have few state level incentives and five of them no Renewable Portfolio Standard (RPS). But States at these latitudes that have more financial incentives produce 20% of solar power (Hawaii, Florida, Texas, Arizona, and New Mexico), and four of them have Renewable Portfolio Standards.
Overall, states at with latitudes of 36 or less produced 86% of solar power, and the 15 states with 13 incentives or more produced 88% of the power, and the 11 states with RPS that began before 2003 produce 75% of the power. Of course, California skews everything with the lion’s share of production.
Conversely, the 14 states above 42 degrees latitude produced just three-tenths (0.003) of all solar power. And the 36 states with few fewest incentives, those with 12 or less, produced just 12% of solar power.
Although the number of state subsidies is a rough indicator of how profitable it might be too build a solar facility, just one large incentive can be enough. For example, until 2016 North Carolina had one of the highest state renewable tax credits, 35%, a big reason why they now generate 5.5% of U.S. solar power.
Texas ought to have more solar power than it does, since it has 20% of potential solar power in the U.S., but developers prefer wind power because it has lower front-end costs and is therefore less risky. Texas also doesn’t have net metering, which allows solar power to be sold back to the grid, which 43 other states have. And electricity is already dirt-cheap, making it hard for any kind of power plant to make profits, especially solar with its high up-front costs.
And it is questionable how much more solar power California will build.
Standford University warns that we may hit a solar wall here (Benson, S., and Majumdar, A. July 12, 2016. On the path to deep decarbonization: Avoiding the solar wall. Stanford University) which I’ve written about here: http://energyskeptic.com/2016/california-has-hit-the-solar-wall/
In addition, the California Energy Commission is concerned about the potential to hit a renewable wall with wind and solar. I’ve added excerpts from these two reports below the Stanford story in the above article.
Meier, Alexandra von. (California Institute for Energy and Environment). 2010. Challenges to the Integration of Renewable Resources at High System Penetration. California Energy Commission. Publication number: CEC-500-2014-042.
CEC. December 2016. Tracking resource flexibility. California Energy Commission
LikeLike