The BP 2018 Statistical Review, electricity and CO2 emissions

The world has made no progress towards decarbonizing its electricity sector over the last three decades.
A guest post by Roger Andrews, first published at Energy Matters.
The just-issued 2018 BP Statistical Review of World Energy contains a number of variables that were not available in previous reports, in particular electricity generation from oil, gas and coal since 1985. Combining these variables with BP’s nuclear, hydro and renewables generation numbers and with BP’s CO2 emissions data reveals the following:
- The world has made no progress towards decarbonizing its electricity sector over the last 32 years. In 1985 it generated 35% of its electricity from low-carbon sources (hydro, nuclear, renewables). In 2017 it generated 34%. Mostly this is a result of rapid emissions growth in China.
- Of the country groups considered, only the EU28 has made any significant progress towards decarbonization (from 41% low-carbon generation in 1985 to 56% in 2017). EU28 emissions, however, make up only a small fraction of total global emissions.
- In 2017 electricity generation accounted for probably less than a third of total global greenhouse gas emissions, which include CO2, methane, NOx etc. Targeting electricity sector emissions while ignoring emissions from other sectors is therefore pointless.
Electricity generation
BP’s generation data are summarized on the following four Figures, each of which contains a graph showing total generation by source followed by a graph showing the percentage contribution of each source to the generation mix between 1985, when the BP data begin, and 2017.
Figure 1 shows global electricity generation. The first graph shows global electricity generation growing by an average of about 3% annually since 1985, although the rate of increase has slowed marginally (to about 2.4% annually) since 2010. Of particular interest is the fact that increased generation from renewables (solar, wind, bio) has been sufficient to cover only about half of the increase in world electricity demand over the last ten years or so. The most remarkable thing about the second graph is the absence of any significant change. Gas has gradually replaced oil but the sum of the two has remained about the same, and coal’s contribution has been effectively constant despite determined efforts to get rid of it. Renewables have shown strong percentage growth in recent years, but all this has done is offset declining percentages of nuclear and hydro generation. The outcome has been no decrease in the percentage of electricity the world obtains from fossil fuels (oil, gas and coal generated 63.9% of the world’s electricity in 1985 and 65.1% in 2017) and no increase in the percentage of low-carbon generation:
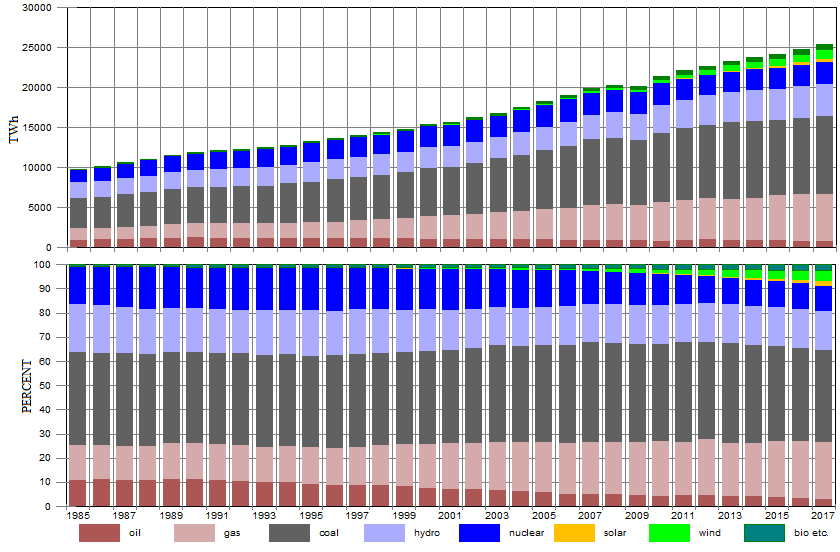
Figure 1: Electricity generation by source and percent of generation mix, global (“bio etc.” includes biomass, geothermal, landfill gas etc.)
Figure 2 shows the BP data for the 34 OECD countries, which include all of the world’s “developed” countries but exclude China, India and Russia. The first graph shows total OECD generation growing between 1985 and 2007 but flattening out since, although how much of this was a result of the 2008-9 global recession and its after-effects is an open question. The percentage of low-carbon generation in the OECD mix (defined by the bottom of the “hydro” bar in the second graph) remained reasonably stable between 1985 and 2012 but has increased since then from 38.1% to 43.1% primarily because of a decrease in coal usage, although increased percentages of renewables also contributed. Another noteworthy feature is the rapid increase in the percentage of total generation supplied by gas:
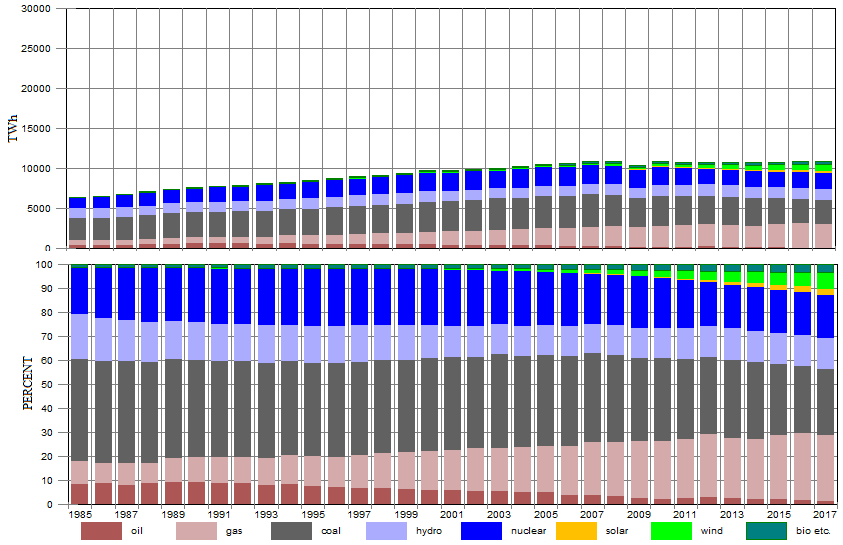
Figure 2: Electricity generation by source and percent of generation mix, OECD countries
Figure 3 shows the data for the non-OECD countries. The first graph shows continued growth in electricity generation since 1985 with an acceleration after about 2000. This growth is largely a result of increased coal generation (mostly in China) and to a lesser extent gas and nuclear generation. Growth in low-carbon generation has not kept pace with increasing demand, partly because there has not been much growth in wind, solar, biomass, etc. and partly because the percentage contributions of hydro and nuclear to the energy mix have declined, as shown in the second graph.
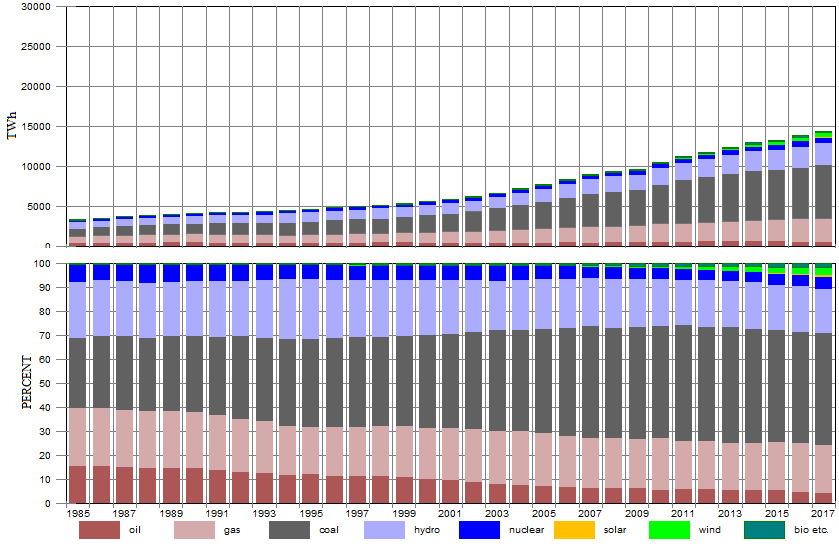
Figure 3: Electricity generation by source and percent of generation mix, non-OECD countries
Figure 4 shows BP’s data for the EU28. The first graph shows that the EU28 is a bit player on the global electricity stage and that what happens there is largely irrelevant. The EU28 has nevertheless succeeded in reversing its electricity generation growth since 2006, although once again the 2008-9 global recession may have has something to do with this. The EU28 has also succeeded in expanding the percentage of renewables in its generation mix to over 20% and in increasing the percentage contribution from low-carbon energy sources from 41.0% in 1985 to 56.1% in 2017. Largely this was at the expense of coal, although the EU28 would have done even better had it been able to maintain the same percentage levels of nuclear and hydro generation in the mix.
The EU28’s main problem now its that its fossil-fuel generation has begun to climb again since 2014 partly because of increased gas consumption, partly because of rollbacks in renewable energy subsidies and partly because of a growing realization – particularly in Germany – that it’s going to be difficult to shut down more coal plants while keeping the lights on:
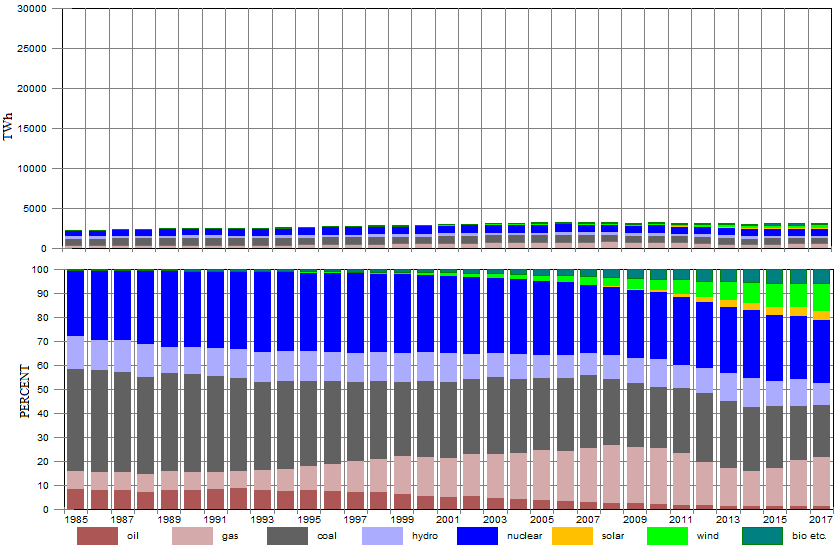
Figure 4: Electricity generation by source and percent of generation mix, EU28
CO2 emissions from the electricity sector
BP’s estimates of CO2 emissions from all fossil fuel sources are summarized in Figure 5. The only event that has made a dent in the upward global trend was the 2008-9 global recession. But even with that global CO2 emissions are now 74% higher than they were in 1985 and 47% higher than they were in 1997, the year the Kyoto Protocol supposedly got the emissions-reduction ball rolling. And as Figure 5 shows, almost all of the increase in global emissions since about 1999 has come from the non-OECD (“developing”) countries, which overtook the OECD (“developed”) countries as the world’s largest CO2 emitters in 1994:
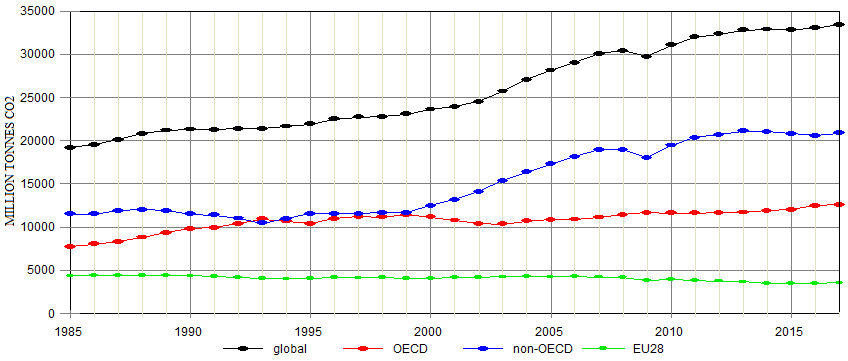
Figure 5: CO2 emissions, global, OECD countries, non-OECD countries and the EU28. (Global emissions are the sum of OECD and non-OECD emissions; EU28 emissions are shown for reference)
Figure 5 focuses attention on non-OECD emissions. Where did they come from? Figure 6 shows that they came dominantly from China with an assist from India. Non-OECD emissions without China and India in fact show no significant change since 1985:
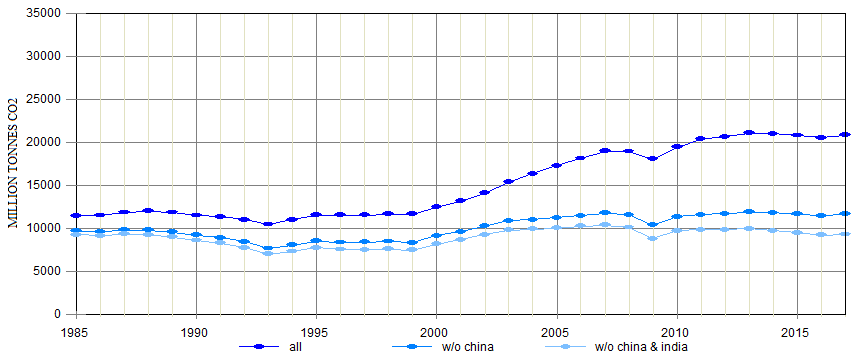
Figure 6: CO2 emissions from electricity generation, non-OECD countries
Electricity’s contribution to total CO2 emissions
What fraction of the world’s total fossil-fuel CO2 emissions are contributed by electricity generation? I have been unable to find any hard numbers, so I made some estimates of my own by combining the global BP generation and CO2 data. Using BP’s 2017 data as an example the procedure was as shown in the Table below. The “Mt CO2 emitted per Mtoe” factors are sourced from the IPCC Fourth Assessment Report:
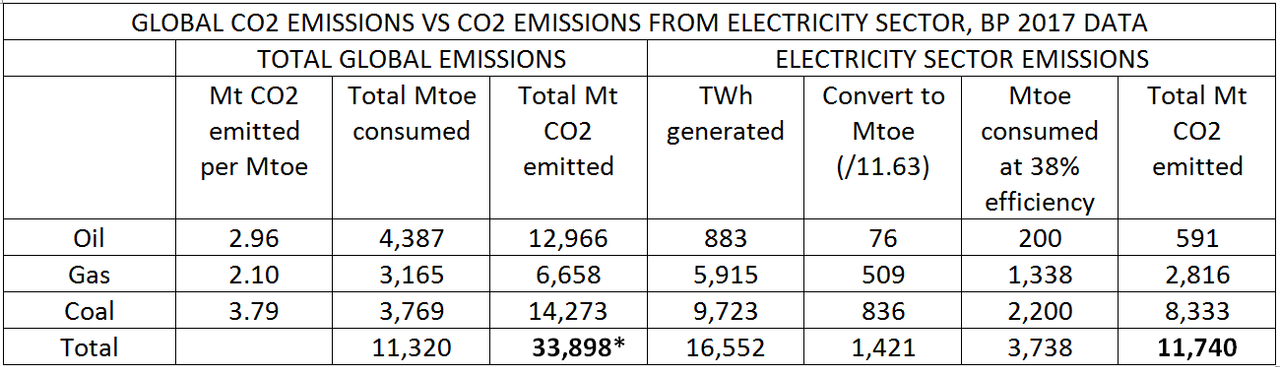
* BP’s estimate of total global CO2 emissions is 33,444 Mt
According to these results 34.7% (11,740/33,838) of the CO2 emitted from global fossil fuel combustion in 2017 came from electricity generation. This number, however, ignores other greenhouse gases such as methane, NOx and HFCs, which come mostly from sources other than fossil fuel combustion. When these are included emissions from electricity generation could fall to less than 30% of total global greenhouse gas emissions, thereby defining the electricity sector as a secondary target for emissions control legislation.
About the author:
Roger Andrews is a retired mining geologist and geophysicist. Born in the UK, he spent most of his professional career in Australia and the USA. He is now retired but continues to write informed, incisive and popular energy analyses for the Energy Matters blog.
Disclaimer:
The views and opinions expressed in this article are the author’s own.

Any possibility to see BP carbon emission for USA and Europe separately. Thank you
LikeLike